
Latest Sectors News

Commerce Secretary says New Delhi secured a higher quota than several other countries after fresh negotiations; discussions on CBAM still on View More

Vedanta plans to significantly increase zinc and lead production capacity by 2031. Aluminium production capacity will double over the next three years. The company targets iron and steel output expansion to fifteen million tonnes annually. Vedanta will invest five billion dollars in its oil and gas business. This expansion aims to meet rising domestic demand and strengthen global presence. View More
Oil-to-metals conglomerate Vedanta on Tuesday unveiled an ambitious expansion roadmap across its metals, mining and energy businesses, outlining plans to sharply increase production capacities over the coming years while committing a $5 billion investment in its oil and gas business. Addressing the company's annual general meeting (AGM), Vedanta Chairman Anil Agarwal said the company aims to nearly triple its zinc and lead production capacity to 3 million tonnes by 2031, reinforcing its position in one of its largest businesses. Also Read: Inside Anil Agarwal’s $100bn vision: Vedanta Resources plans to relist with US as a likely target The company also plans to double aluminium production capacity to 6 million tonnes per year over the next three years, while its iron and steel business is targeted to expand from 4 million tonnes to 15 million tonnes annually, Agarwal said. On the energy front, Agarwal said Vedanta would invest $5 billion over the next three to five years to expand its oil and gas business. Live Events "Will invest $5 bln over three to five years for Vedanta Oil & Gas," he said at the AGM. Also Read: A titan in tears: Anil Agarwal’s gritty journey from Bihar to billions He added that the company is targeting oil production of 500,000 barrels per day, saying, "At Vedanta Oil and Gas , we aim to produce 500,000 barrels per day." The expansion plans underscore Vedanta's strategy to significantly scale up capacity across its core businesses as it seeks to meet rising domestic demand while strengthening its global presence in metals and natural resources. The comments come as the conglomerate's four demerged entities- Vedanta Aluminium Metal Ltd, Vedanta Oil & Gas Ltd, Vedanta Power Ltd and Vedanta Iron & Steel Ltd- debuted on stock exchanges on June 15. Vedanta Oil & Gas reported a 16% year-on-year decline in average daily gross operated production in FY26, while revenue fell 13% to Rs 9,582 crore, according to an investor presentation dated April 29. EBITDA declined 7% from a year earlier to Rs 4,664 crore. The company's future will be built on three Ps — Produce More, Partner Better and Purpose Beyond Profit. Reflecting on the successful completion of Vedanta's demerger, he mentioned that each of the Group's five pure-play entities -- Vedanta Ltd , Vedanta Aluminium Metal Ltd, Vedanta Oil and Gas Ltd, Vedanta Iron and Steel Ltd, and Vedanta Power Ltd -- has the potential to become a USD 100-billion company. Highlighting technology as Vedanta's strongest partner, Agarwal said, "The future belongs to companies that embrace technology. Artificial intelligence is transforming industries across the world. Technology is our best partner. Whether it is exploration, operations, sustainability, safety or productivity, we are deeply embedding technology across every one of our businesses. Our goal is simple: To become smarter, faster, safer, and better." ( With inputs from PTI ) .Pbanner{display:flex;justify-content:space-between;align-items:center;background-color:#ec1c40;margin-top:20px;padding:5px 10px;border-radius:4px;color:#fff;line-height:10px;width: 100%;box-sizing: border-box} .Pbannertext{display:flex;align-items:center;font-size:16px;font-weight:600;font-family:'Montserrat';} .Pbannertext img{height:20px;margin:0 6px} .Pbannerbutton a{display:flex;align-items:center;background-color:#fff;color:#ec1c40;text-decoration:none;font-weight:600;padding:4px 8px;border-radius:6px;font-size:15px;font-family:'Montserrat';} .Pbannerbutton img{height:20px;margin-right:6px} .Pbannerbutton a:hover{background-color:#f7f7f7} Add as a Reliable and Trusted News Source Add Now! (You can now subscribe to our Economic Times WhatsApp channel) (You can now subscribe to our Economic Times WhatsApp channel)

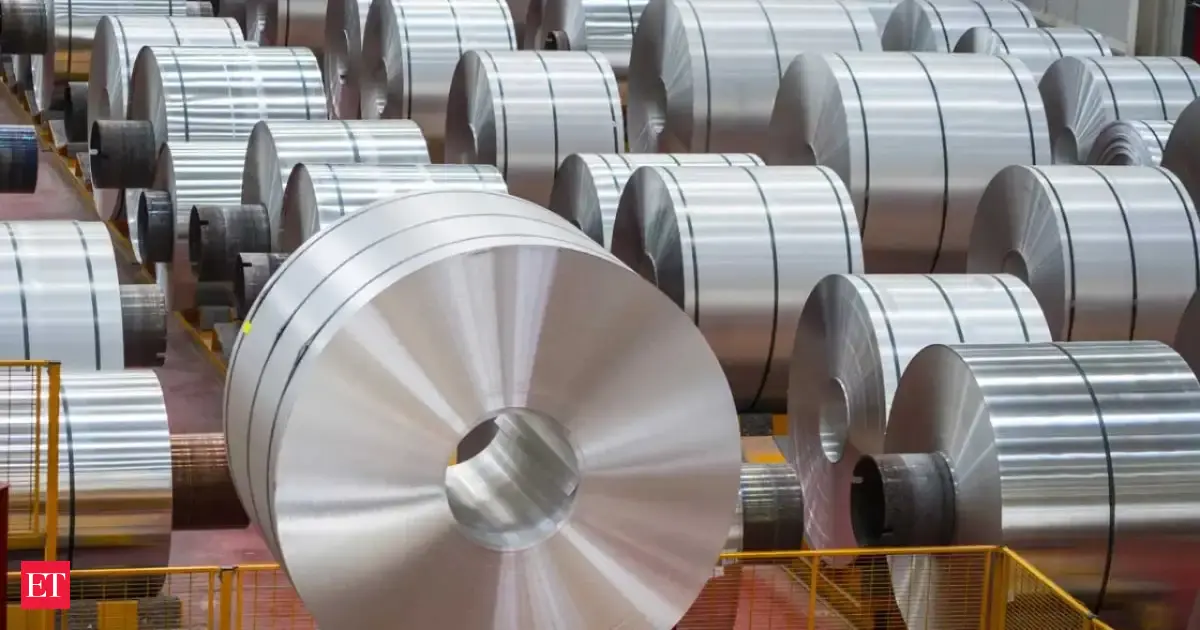
Domestic steel prices are expected to remain mixed in the coming months. Long steel prices will likely stay under pressure due to monsoon demand weakness. Flat steel prices should remain relatively resilient, supported by lower imports. Raw material costs for steel production are also showing varied trends. This outlook reflects current market conditions and anticipated seasonal impacts. View More
New Delhi: Domestic steel prices are expected to remain mixed in the coming months, with long steel prices likely to stay under pressure due to weak demand during the monsoon season and high inventory levels, according to a Centrum report. The report said global and domestic steel prices showed mixed trends. US hot rolled coil (HRC) prices rose around 3 per cent month-on-month, marking the eighth straight month of gains. In contrast, European HRC prices declined about 4 per cent for the second consecutive month, while China's export HRC prices fell around 1 per cent after six months of continuous gains. Also Read: India will monitor Chinese steel imports before deciding on further curbs, source says In India, domestic HRC prices remained largely stable, supported by safeguard duties on imports and firm global prices. However, "long steel prices witnessed a sharp correction, with primary rebar declining ~9% MoM, giving back part of the strong rally seen since late 2025." The report attributed the decline to weak construction activity, higher inventories, aggressive trader discounts and increased competition from secondary rebar producers. Live Events Centrum said the weakness continued in July, noting that "spot HRC and primary rebar prices down ~Rs 210/tonne and ~Rs 3,020/tonne, respectively, from June averages." It also said prices of 304-grade stainless steel fell around 3 per cent month-on-month in June but remained about 19 per cent higher than the same period last year. Among raw materials, Australian iron ore prices declined around 7 per cent month-on-month. In India, NMDC reduced lump ore prices by Rs 250 per tonne and fine ore prices by Rs 150 per tonne. The report added that Australian coking coal prices increased about 2 per cent month-on-month and 36 per cent year-on-year due to limited spot supplies, firm supplier pricing and stronger demand from China following disruptions at domestic mines. South African non-coking coal prices remained largely unchanged from the previous month but were still 22 per cent higher than a year ago. In the non-ferrous metals segment, aluminium was the weakest performer. Also Read: Indian steelmakers grapple with resurgence of cheap Chinese imports On the outlook, the report said, "Going ahead, the domestic steel pricing environment is likely to remain mixed. Long steel prices are expected to stay under pressure amid monsoon-related demand weakness and elevated inventories, while flat steel prices should remain relatively resilient, supported by lower imports and steady raw material costs." .Pbanner{display:flex;justify-content:space-between;align-items:center;background-color:#ec1c40;margin-top:20px;padding:5px 10px;border-radius:4px;color:#fff;line-height:10px;width: 100%;box-sizing: border-box} .Pbannertext{display:flex;align-items:center;font-size:16px;font-weight:600;font-family:'Montserrat';} .Pbannertext img{height:20px;margin:0 6px} .Pbannerbutton a{display:flex;align-items:center;background-color:#fff;color:#ec1c40;text-decoration:none;font-weight:600;padding:4px 8px;border-radius:6px;font-size:15px;font-family:'Montserrat';} .Pbannerbutton img{height:20px;margin-right:6px} .Pbannerbutton a:hover{background-color:#f7f7f7} Add as a Reliable and Trusted News Source Add Now! (You can now subscribe to our Economic Times WhatsApp channel) (You can now subscribe to our Economic Times WhatsApp channel)

Rare earth minerals explained: Rare earths are vital for modern technology and defense applications. China dominates global processing, creating strategic supply chain vulnerabilities. Demand for these minerals is projected to grow significantly in coming years. India faces dependence on China for critical rare earth products. Diversifying supply chains requires substantial investment and international cooperation. View More
From the smartphone in your pocket to the fighter jet in the sky, one obscure family of metals quietly powers modern life and modern warfare. Rare earths have moved from a niche geological curiosity to a front-and-centre issue in global diplomacy, trade wars and defence planning. As Asit Saha, Director General of the Geological Survey of India (GSI), puts it, the concentration of rare earth processing capacities in a handful of geographies "has transformed these commodities from industrial raw materials into strategic assets," with mineral security today becoming "increasingly synonymous with economic and strategic security." Here is everything you need to know about rare earth minerals , why are they important and which countries have the largest reserves? Also read: Critical minerals, strategic stakes: Inside India's bid to break China's supply chain stranglehold What are rare earth minerals? Rare earths are a group of 17 metals with similar chemical properties but distinct physical and magnetic characteristics. Among these, the "magnet rare earths" neodymium, praseodymium, dysprosium and terbium, are the most commercially important. Live Events According to the International Energy Agency's (IEA) latest report, magnets made from these elements account for around 95% of the total value of rare earth consumption worldwide. These neodymium-iron-boron (NdFeB) magnets are among the strongest permanent magnets used in industry today, going into EV motors, wind turbines, industrial machinery, smartphones, hard drives, medical scanners, missile guidance systems and fighter jets, the invisible ingredient behind almost anything that needs to spin, sense or move precisely. Turning rock into a usable magnet is a long, technically demanding chain: ore is mined, crushed and concentrated, then chemically upgraded and separated, the hardest step, before being refined into metals, alloyed, and finally pressed into magnets. Losing capability at even one stage can bottleneck the entire chain. Why are they so important? Rare earths sit at the intersection of clean energy, advanced technology and national defence. Demand for magnet rare earths has already doubled since 2015, driven by EVs and wind turbines, and is set to grow another third by 2030 under existing policies, per the IEA. Automation, robotics and AI-linked hardware are expected to push demand even higher after 2030. The stakes became evident in 2025. When China tightened export controls that year, the resulting disruption threatened downstream production worth an estimated USD 6.5 trillion annually across countries outside China, per IEA data, over USD 3 trillion of that in automotives alone, with electronics, aviation, defence and data centres also exposed. The US and Europe each faced potential direct losses exceeding USD 1.5 trillion. That's why governments now treat rare earths less like a commodity and more like a strategic asset, on par with oil or semiconductors, with everyday uses ranging from LCD screens and satellites to certain cancer treatment drugs. Why are they called 'rare' if found worldwide? Here's the paradox: rare earths aren't actually rare. Most of the 17 elements are relatively abundant in the Earth's crust, some more common than gold or silver. The US Geological Survey (USGS) estimated global deposits at around 110 million tonnes in 2024. Also read: India, Russia deepen rare earths ties amid Quad critical minerals push What makes them "rare" is extractability, not scarcity. Economically viable, concentrated deposits are uncommon, and the elements are almost never found in pure form, their near-identical chemistry makes separation extremely difficult and only a handful of facilities worldwide can do it at scale. The process also carries real environmental costs: techniques like in-situ leaching produce acidic leachate and radioactive tailings, since rare earth ores often co-occur with thorium and uranium. High costs and environmental liabilities mean few companies pursue this without strong policy support, leaving the world dependent on one dominant supplier. Which countries have the largest reserves? China holds the largest known reserves at around 44 million tonnes (USGS), a substantial share of the global total. But Vietnam, Brazil, Russia and India also hold significant reserves, while Australia, the US, Lao PDR and Tanzania feature prominently in upcoming mining projects, per the IEA. Mining is actually the stage where diversification is furthest along: non-China projects could push mining capacity past 50 kilotonnes of rare earth content by 2035, led by Australia and the US. The real bottleneck lies further down the chain. Why does China dominate the supply chain? Having reserves is only part of the story, it's processing where China's dominance is overwhelming. In 2024, China accounted for 60% of global mined production of magnet rare earths, but 91% of refining and 94% of finished sintered permanent magnets, per IEA data — up sharply from around 50% in 2005. This scale has created a virtuous cycle: cheap, stable domestic demand feeding back into cheaper production. Competitors face the opposite, smaller scale, higher costs, tougher permitting, and buyers who want proven reliability before signing contracts. As Saha notes, "the principal bottlenecks are no longer confined to geological discovery. The greater challenge lies in establishing large-scale beneficiation, separation, refining and advanced material manufacturing capabilities." This concentration has already bitten twice. In April 2025, Beijing's export controls on seven heavy rare earths caused exports to collapse within weeks, forcing some automakers in the US and Europe to slow or halt production. In October 2025, China expanded the list to 12 elements and added a licensing requirement covering any global product containing Chinese-sourced rare earths or made using Chinese technology. The curbs were suspended in November 2025, but in January 2026 China tightened separate controls on dual-use goods bound for Japan, a sign tensions remain unresolved. Where does that leave India? India's exposure isn't abstract. Kaira Rakheja, Energy Analyst at the Institute for Energy Economics and Financial Analysis (IEEFA), notes that "India's dependence on China is significant and spans from raw materials into downstream products and technologies," making diversification "an economic priority and also a matter of industrial and national security now." India's rare earth imports rose from roughly USD 14.1 million in 2014 to USD 17.5 million in 2024, with over 45% sourced from China, per Rakheja. The exposure is starker in finished products, China accounted for 59.6% to 81.3% of India's permanent magnet imports by value between 2022-23 and 2024-25, magnets that feed directly into India's EV, wind, electronics and defence programmes. Closing this gap, Rakheja cautions, isn't just about mining more ore, India's real gap is in "technology, environmental management capabilities, and downstream industries that can absorb processed materials." She sees India's talent pool and cost competitiveness as advantages, but says progress will likely need Quad-style cooperation extending into technology transfer, not just financing. The IEA estimates diversifying global supply chains needs around USD 60 billion in investment over the next decade, with refining and magnet manufacturing accounting for nearly 80% of that. It's a large number, but dwarfed by the potential USD 6.5 trillion annual cost of a full supply disruption, which is exactly why rare earths, and India's place in the chain, remain one of this decade's defining strategic battlegrounds. .Pbanner{display:flex;justify-content:space-between;align-items:center;background-color:#ec1c40;margin-top:20px;padding:5px 10px;border-radius:4px;color:#fff;line-height:10px;width: 100%;box-sizing: border-box} .Pbannertext{display:flex;align-items:center;font-size:16px;font-weight:600;font-family:'Montserrat';} .Pbannertext img{height:20px;margin:0 6px} .Pbannerbutton a{display:flex;align-items:center;background-color:#fff;color:#ec1c40;text-decoration:none;font-weight:600;padding:4px 8px;border-radius:6px;font-size:15px;font-family:'Montserrat';} .Pbannerbutton img{height:20px;margin-right:6px} .Pbannerbutton a:hover{background-color:#f7f7f7} Add as a Reliable and Trusted News Source Add Now! (You can now subscribe to our Economic Times WhatsApp channel) (You can now subscribe to our Economic Times WhatsApp channel)

China's exports to the U.S. jumped around 14% last month while imports grew 26%, according to CNBC calculation of the official data. View More
NANJING, CHINA - JULY 09: Aerial view of new energy vehicles waiting for shipment at Longtan Port Area of Nanjing Port on July 9, 2026 in Nanjing, Jiangsu Province of China. Yang Suping | Visual China Group | Getty Images China's trade growth accelerated far more than expected in June, as booming global demand for AI hardware and a rush by exporters to beat anticipated U.S. tariff hikes turbocharged shipments. Overall exports rose 27% from a year earlier in U.S. dollar terms, the strongest since October 2021, customs data showed Tuesday, quickening from the 19.4% gain in May and sharply beat economists' estimates for a 18.2% growth. In the first half-year, China's fastest-growing export categories were semiconductors, rare earths, autos and ships, while laggards included toys, footwear, steel and furniture. The country's shipments to the U.S. jumped around 14% last month, while imports grew 26%, according to CNBC calculation of the official data. Factory activity accelerated in June, as U.S.-bound orders recorded sharp year-on-year gains, according to China Beige Book, pushing up freight rates. Manufacturers are bracing for additional tariffs from U.S. President Donald Trump's Section 301 probes as the 10% broad-based duty is set to expire on July 24. China's exports to the U.S. have returned to positive territory in the first half of this year after experiencing double-digit year-on-year declines for most of last year. watch nowVIDEO4:5204:52Chinese exports to EM markets will dampen inflation there: PIMCOThe China Connection Imports grew 36% in June, the largest jump since June 2021, gaining pace from the 27.4% growth in May and sharply beating economists' forecast for a 24% growth. The trade surplus stood at $125.6 billion in June. Similar to exports, the import strength was concentrated in high-tech products, while persistent weakness in other categories pointing to sluggish domestic demand.Beijing has grappled with a deepening supply-demand imbalance, as strong industrial output and exports tied to the global AI investment boom continue to power headline growth, even as consumption and private investment weakens amid a prolonged property downturn and volatile global oil prices. Exports will likely remain strong in the second half of the year, said Zhiwei Zhang, president and chief economist at Pinpoint Asset Management, potentially further increasing trade tensions between China and trading partners, particularly Europe. Brussels and Beijing set up a trade and investment consultation mechanism last month aimed at rebalancing bilateral trade, with European officials targeting October for "tangible results." Shipment to the EU and the Association of Southeast Asian Nations rose 18.5% and 35%, respectively, while imports jumped 9% and 27%, the customs data showed. Another wildcard is the Russia sanctions bill proposed by the late U.S. Senator Lindsey Graham, which originally suggested secondary tariffs of up to 500% on goods from countries buying Russian oil and gas â a penalty that would hit China, the largest buyer of Russian crude."These factors could potentially throw a wrench in the excellent export performance so far," said Lynn Song, chief economist for Greater China at ING Bank. Oil import fell to decade-low China's crude imports dropped 41% from a year earlier to 29.3 million tons, according to CNBC calculations, reportedly the lowest level in nearly a decade. In the first half-year, China's total oil imports dropped 11% from a year ago in terms of volume. "This appears to reflect inventory drawdowns rather than a collapse in oil demand," said Julian Evans-Pritchard, head of China economics. China is expected to release its gross domestic product growth for the second quarter on Wednesday. Economists polled by Reuters expect growth to have slowed to 4.5% in the second quarter, after a solid 5% in the first quarter. Industrial output and retail sales for June, also due Wednesday, are projected to expand 4.7% and shrink 0.1%, respectively. Urban investment is estimated to decline 4.9% in the first half-year, deepening from 4.1% in the first five months, according to a Reuters poll.Investors are now looking to an expected Politburo meeting in late July for clues on stimulus that could shape policy for the rest of the year, although analysts expect no meaningful stimulus unless growth slows more sharply, given resilient exports and Beijing's focus on curbing excess factory capacity to fight deflation. Choose CNBC as your preferred source on Google and never miss a moment from the most trusted name in business news.

Caliber Mining & Logistics announced its Rs 450-crore IPO price band of Rs 402 to Rs 424. The public issue will open for subscription on July 17 and close on July 21. The company plans to use IPO proceeds for debt repayment and capital expenditure. View More
Caliber Mining & Logistics Ltd. announced the price band for its Rs 450-crore Initial Public Offering (IPO) on Tuesday at Rs 402–424 per equity share. The public issue will open for subscription on July 17, 2026, and close on July 21, 2026. The IPO comprises a fresh issue of 94 lakh equity shares worth Rs 400 crore and an offer for sale (OFS) of 12 lakh crore shares aggregating to Rs 50 crore. The OFS includes shares being sold by promoters Mohit Satishkumar Chadda, Anuj Krishanlal Chadda, Manish Krishanlal Chadda, and Rahul Roshanlal Chadda. The company expects to finalise the share allotment on July 22, while the shares are tentatively scheduled to debut on the BSE and NSE on July 24. At the upper price band, retail investors will need a minimum investment of Rs 14,840 for one lot of 35 equity shares.DAM Capital Advisors Ltd. is the book-running lead manager to the issue, while KFin Technologies Ltd. has been appointed as the registrar. About Caliber Mining & Logistics Incorporated in 2014, Caliber Mining & Logistics is an integrated mining services company focused on coal extraction and logistics. Its offerings span the entire mining value chain—overburden removal, coal loading and unloading, road transportation, and rail logistics coordination—making it a comprehensive mining and logistics solutions provider. Live Events The company primarily serves subsidiaries of Coal India Ltd. , with Western Coalfields Ltd. (WCL) and Northern Coalfields Ltd. (NCL) among its key customers. Caliber has been operating in the coal logistics business since FY16, providing end-to-end solutions for coal transportation. In FY23, the company diversified its logistics portfolio by expanding services to the iron ore sector. Its mining and overburden removal operations are spread across Maharashtra, Chhattisgarh, and Madhya Pradesh. Utilisation of IPO Proceeds The company intends to use the net proceeds from the fresh issue to strengthen its balance sheet and expand its operational capabilities. Of the total proceeds, Rs 175 crore will be used for the repayment or prepayment of certain borrowings, while Rs 200 crore has been earmarked for capital expenditure towards the purchase of machinery. The remaining funds will be deployed for general corporate purposes. (Disclaimer: Recommendations, suggestions, views and opinions given by the experts are their own. These do not represent the views of Economic Times) .Pbanner{display:flex;justify-content:space-between;align-items:center;background-color:#ec1c40;margin-top:20px;padding:5px 10px;border-radius:4px;color:#fff;line-height:10px;width: 100%;box-sizing: border-box} .Pbannertext{display:flex;align-items:center;font-size:16px;font-weight:600;font-family:'Montserrat';} .Pbannertext img{height:20px;margin:0 6px} .Pbannerbutton a{display:flex;align-items:center;background-color:#fff;color:#ec1c40;text-decoration:none;font-weight:600;padding:4px 8px;border-radius:6px;font-size:15px;font-family:'Montserrat';} .Pbannerbutton img{height:20px;margin-right:6px} .Pbannerbutton a:hover{background-color:#f7f7f7} Add as a Reliable and Trusted News Source Add Now! (You can now subscribe to our ETMarkets WhatsApp channel) (You can now subscribe to our ETMarkets WhatsApp channel)

Economy is a key category in CNBC’s America’s Top States for Business study, and some states stand out for the wrong reasons. View More
In this articleIRMLMTWMBHASMARETRPOOLFollow your favorite stocksCREATE FREE ACCOUNT Most economists now seem to agree that the immediate threat of a recession has passed, but that does not mean there is not concern about inflation, geopolitical tensions or a bursting AI bubble knocking the economy off track. Some states are better situated to weather a downturn than others. Companies know that, so they look for states with stable economies when deciding where to set up shop. States know it, too, so many continue to market themselves as economic havens.  "Companies can thrive in a world-class business environment with the most diverse economy in the nation," Illinois' economic development site proclaims. "In Michigan, you'll find a global network of leading companies across numerous industries," its state site notes. "From Fortune 500 companies to fast-growing startups and hundreds of thousands of small businesses, companies of all sizes are driving economic opportunity in every corner of our state." CNBC analyzes every state's marketing pitch as part of our annual America's Top States for Business study. This year, we found the economy to be the second most frequently mentioned attribute (after infrastructure). So, under our methodology, the Economy category carries the second-heaviest weight in 2026âworth 16.6% of a state's total score. To measure each state's economy, we consider job growth, economic growth, and the number of major companies headquartered in the state. We also measure each state's fiscal health, including its budget situation, its long-term obligations and its debt ratings, as well as the health of the residential real estate market. We also consider the impact of tariffs, the potential impact of federal budget cuts, and small business survival rates. Some states clearly deliver on their economic promises, but these are not those states. Here are America's worst state economies in 2026. 10. Oklahoma Downtown Oklahoma City.Art Wager | Istock | Getty Images Oklahoma is among the most dependent on federal funding, according to the National Association of State Budget Officers. More than 40% of state spending in Oklahoma comes from Washington, D.C., putting the state in the top 10 for reliance on the feds. "That's not rugged individualism; that's a subsidy," wrote Shiloh Kantz of the Oklahoma Policy Institute in August. "And it means that the hard fiscal choices some of our leaders brag about are possible only because someone else is footing the bill."  It also leaves the Sooner State vulnerable to potential federal cuts. Economic growth was moderate last year, which is leaving the housing market under some stress. 2026 Economy score: 172 out of 415 points (Top States grade: D) Real GDP (2025): $213.5 billion (+1.5%) Debt Rating and outlook (Moody's): Aa1, Stable Share of state spending from federal funds: 40.4% International goods trade: $24.9 billion (9% of GDP) Major corporations: Paycom Software, ONEOK, The Williams Companies 9. North Dakota Oil well pumpjacks at work in the oil fields of North Dakota. John Coletti | Photodisc | Getty Images The days of North Dakota's oil frenzy back in the early 2000s and 2010s are long gone, and even the surge in oil prices at the start of the Iran war earlier this year was not enough to get companies to resume drilling in the Bakken Shale in a meaningful way. Economic growth in the Peace Garden State was the lowest in the nation last year. New business formations were also among the lowest. One thing the state did right was to build up its reserves during the flush times. The state could last nearly a year on its total fund balance if all else failed, according to the Pew Charitable Trusts. 2026 Economy score: 171 out of 415 points (Top States grade: D) Real GDP (2025): $63.6 billion (+0.3%) Debt Rating and outlook (Moody's): Aa1, Stable Share of state spending from federal funds: 34.5% International goods trade: $14.5 billion (17.6% of GDP) Major corporations: None 8. New Hampshire Aerial view of Concord and the New Hampshire State House. Ultima_gaina | Istock | Getty Images New Hampshire's fiscal situation is anything but rock solid. The Granite State's spending outpaces revenues, according to the most recent financial disclosures. New Hampshire's public employee retirement systems are underfunded to the tune of more than $5.5 billion, among the worst pension gaps in the country. Job growth is tepid, and the survival rate for new businesses is among the lowest in the country, according to data provided to CNBC by business research firm Construction Coverage. The state's economy is growing at a healthy pace, however, with the help of new residents fleeing higher taxes in neighboring states like Massachusetts. 2026 Economy score: 170 out of 415 points (Top States grade: D) Real GDP (2025): $96.87 billion (+2.1%) Debt Rating and outlook (Moody's): Aa1, Stable Share of state spending from federal funds: 39.4% International goods trade: $17.2 billion (13.7% of GDP) Major corporation: Iron Mountain 7. Alaska Alaska oil pipeline, Alaska range.Patrick J. Endres | Corbis Documentary | Getty Images Alaska is heavily dependent on the federal government, which accounts for more than 45% of state spending. Only Louisiana (48.6%) and Indiana (46.3%) rely more on Uncle Sam. The Last Frontier also has among the largest percentages of federal employees in its workforce. Alaska did turn in solid economic growth last year, even before the surge in oil prices this past February. And optimism is growing as the Trump administration moves to expand drilling in the North Slope and pursues an 807-mile natural gas pipeline to deliver gas from Prudhoe Bay on the North Slope to the Kenai Peninsula and the world.  "Alignment of state and federal leadership means potential for major moves in Alaska's mining and oil and gas development," wrote state economist Karinne Wiebold in January, though the pipeline â and any economic windfall that comes with it â is still years away. 2026 Economy score: 169 out of 415 points (Top States grade: Dâ) Real GDP (2025): $57.5 billion (+2.8%) Debt Rating and outlook (Moody's): Aa2, Stable Share of state spending from federal funds: 45.3% International goods trade: $9.8 billion (13.1% of GDP) Major corporations: None 6. South Dakota Mount Rushmore, South Dakota.©Anitaburke | Moment | Getty Images Economic growth was modest last year in South Dakota, but to hear state officials tell it, things are looking up â and they are not referring to the Mount Rushmore State's most famous, lofty attraction. Earlier this year, in her first-quarter economic update, Secretary of State Monae Johnson pointed to nearly 4,000 new business filings in the quarter, "surpassing first-quarter filing totals from each of the previous six years." She did not mention that the comparisons were relatively easy. According to Census data, South Dakota ranked 35th in new business formations per capita last year, growing only about 4% from 2024. Once businesses do get off the ground in South Dakota, however, they stand a good chance of surviving. The state ranks No. 15 in Construction Coverage's small business survival index. 2026 Economy score: 168 out of 415 points (Top States grade: Dâ) Real GDP (2025): $58.5 billion (+1.4%) Debt Rating and outlook (Moody's): Aaa, Stable Share of state spending from federal funds: 42.4% International goods trade: $4.88 billion (6% of GDP) Major corporations: None 5. Kansas Wichita, Kansas.Cweimer4 | Istock | Getty Images The housing market in Kansas is a study in contrasts. Inventory is tight, with around a two-month supply of homes on the market as of May, according to Redfin. Yet, price appreciation has been modest, and seller gains have been weak, according to ATTOM Data Solutions. It all means that the real estate market is not the economic engine it might normally be. One reason may be that the Sunflower State is not doing well in attracting workers, according to data from labor market analytics firm Lightcast. Job growth in the state is weak, though overall economic growth was reasonably good last year. 2026 Economy score: 162 out of 415 points (Top States grade: Dâ) Real GDP (2025): $185.1 billion (+2%) Debt Rating and outlook (Moody's): Aa2, Stable Share of state spending from federal funds: 27.4% International goods trade: $29.4 billion (12.2% of GDP) Major corporations: None 4. Louisiana French Quarter, Jackson Square, New Orleans.Andrey Denisyuk | Moment | Getty Images Louisiana faces serious exposure to a pair of stiff headwinds in the economy: tariffs, and a shrinking federal government in a state that disproportionately relies on Washington. No state has more of its spending funded by the federal government. And with nearly one-third of the Pelican State's GDP made up of international goods trade, Louisiana's tariff costs have skyrocketed, according to Washington, D.C.-based research firm Trade Partnership Worldwide, which provided data to CNBC. Perhaps as a result, Louisiana has seen some of the weakest economic growth in the nation. Overall job growth has been strong but uneven. The latest forecast from Louisiana State University's E.J. Ourso College of Business, through the first quarter of next year, calls for more job growth, "but employment in only 4 of the state's metro areas is forecast to grow at a rate of 1% or greater." The forecast calls for modest improvement in GDP, growing at a rate of about 1.5% into the beginning of 2027. 2026 Economy score: 160 out of 415 points (Top States grade: Dâ) Real GDP (2025): $259.9 billion (+1.1%) Debt Rating and outlook (Moody's): Aa2, Stable Share of state spending from federal funds: 48.6% International goods trade: $109.4 billion (32.2% of GDP) Major corporations: Pool, Entergy 3. West Virginia Residential street in downtown Charleston, West Virginia.Benedek | E+ | Getty Images West Virginia is not handling the transition from a coal-centered economy to whatever comes next well. The Mountain State's labor force participation rate is the lowest in the nation, even as prices rise â putting more and more everyday needs out of reach. Economic growth and job growth rank near the bottom. One potential bright spot â and maybe a lifeline â is the state's housing market. Inventory is near optimum, affordability is good, and yet prices are appreciating well. 2026 Economy score: 146 out of 415 points (Top States grade: F) Real GDP (2025): $83.2 billion (+0.5%) Debt Rating and outlook (Moody's): Aa2, Positive Share of state spending from federal funds: 20.5% International goods trade: $9.5 billion (8.7% of GDP) Major corporations: None 2. Maryland Baltimore, Maryland.Kruck20 | Istock | Getty Images Economic growth and job growth nearly flatlined in Maryland over the past year. The Old Line State's deep connection with the federal government next door has a lot to do with that, as Gov. Wes Moore pointed out in his State of the State address in February. "In just the last year, the federal government has fired around 25,000 Marylanders who have federal jobs in our state alone," said Moore, a Democrat. "It's the biggest federal job cut of any state in the country." But the Maryland Chamber of Commerce also blames "high costs, unpredictable taxes, and growing regulatory burdens." "If we want a stronger future, we must prioritize an economy that supports business investment, expansion, and long-term growth," the organization said. Whatever the reason, Maryland finds itself in a deep hole in 2026, with no easy way out of it. 2026 Economy score: 143 out of 415 points (Top States grade: F) Real GDP (2025): $436.17 billion (+0.7%) Debt rating and outlook (Moody's): Aa1, Stable Share of state spending from federal funds: 31.2% International goods trade: $56.6 billion (10% of GDP) Major corporations: McCormick and Company, Lockheed Martin, Marriott International 1. Rhode Island Providence, Rhode Island.Denistangneyjr | Istock | Getty Images To hear Rhode Island Gov. Dan McKee tell it, the state is about to have its moment. McKee, a Democrat, writes on a website devoted to what he calls the RI 2030 Plan that "National shifts in defense spending, the return of advanced manufacturing, and rapid technological innovation are aligning with Rhode Island's long-standing strengths in defense, ocean technology, and the life sciences." But if, indeed, the Ocean State's ship is about to come in, it is taking a long time getting there. In the meantime, economic growth was the ninth weakest in the country last year. Foreign direct investment was practically nonexistent, as were new business formations.  Rhode Island is also especially vulnerable to tariffs. Costs skyrocketed last year in a state where international goods trade makes up over 18% of nominal GDP. 2026 Economy score: 121 out of 415 points (Top States grade: F) Real GDP (2025): $64.2 billion (+1.1%) Debt rating and outlook (Moody's): Aa2, Stable Share of state spending from federal funds: 38.5% International goods trade: $15.5 billion (18.5% of GDP) Major corporations: Hasbro, Citizens Financial Group, CVS Health Choose CNBC as your preferred source on Google and never miss a moment from the most trusted name in business news.

The plea had assailed the Rules as being ultra vires to Articles 14 (right to equality) and 19(1)(g) (freedom to conduct business) of the Constitution View More

Gautam Malhotra, CEO of Jindal Steel, has resigned from his position. His resignation is effective from July 15, 2026, due to personal commitments. Malhotra expressed appreciation for the support received from colleagues and the board. The company's board will meet on July 24, 2026, to approve financial results. Jindal Steel has not yet announced a replacement for the chief executive. View More
New Delhi, Gautam Malhotra, the Chief Executive Officer of Jindal Steel , has resigned ahead of the company's board meeting scheduled for next week. Malhotra, who was serving as the CEO of the company since October 28 last year, has cited personal reasons for his resignation, which is effective from the close of business hours on July 15, 2026. "I hereby submit my request to be relieved from the services of the company due to personal commitments. I sincerely appreciate the guidance and support extended by your goodself, the Board of Directors, my colleagues, and the entire Jindal Steel team," Malhotra said in the resignation letter available on the exchanges. His resignation comes ahead of the meeting of the Board of Directors of Jindal Steel on July 24, 2026 to consider and approve the unaudited financial results of the company for the first quarter of FY27. The company has not named the new CEO yet. Live Events Jindal Steel is one of the leading steel making entities in the country. .Pbanner{display:flex;justify-content:space-between;align-items:center;background-color:#ec1c40;margin-top:20px;padding:5px 10px;border-radius:4px;color:#fff;line-height:10px;width: 100%;box-sizing: border-box} .Pbannertext{display:flex;align-items:center;font-size:16px;font-weight:600;font-family:'Montserrat';} .Pbannertext img{height:20px;margin:0 6px} .Pbannerbutton a{display:flex;align-items:center;background-color:#fff;color:#ec1c40;text-decoration:none;font-weight:600;padding:4px 8px;border-radius:6px;font-size:15px;font-family:'Montserrat';} .Pbannerbutton img{height:20px;margin-right:6px} .Pbannerbutton a:hover{background-color:#f7f7f7} Add as a Reliable and Trusted News Source Add Now! (You can now subscribe to our Economic Times WhatsApp channel) (You can now subscribe to our Economic Times WhatsApp channel)